
See how much Spill's EAP would cost your business
See pricingAn Employee Assistance Program (EAP) will probably be your first port of call if you’re looking to bring in some external mental health support for your team. They’re a useful workplace benefit offering cheap, blanket coverage for all employees. Because of this, lots of companies have an EAP. But how many employees actually use them? What kind of impact do they have? And can their return on investment be measured?
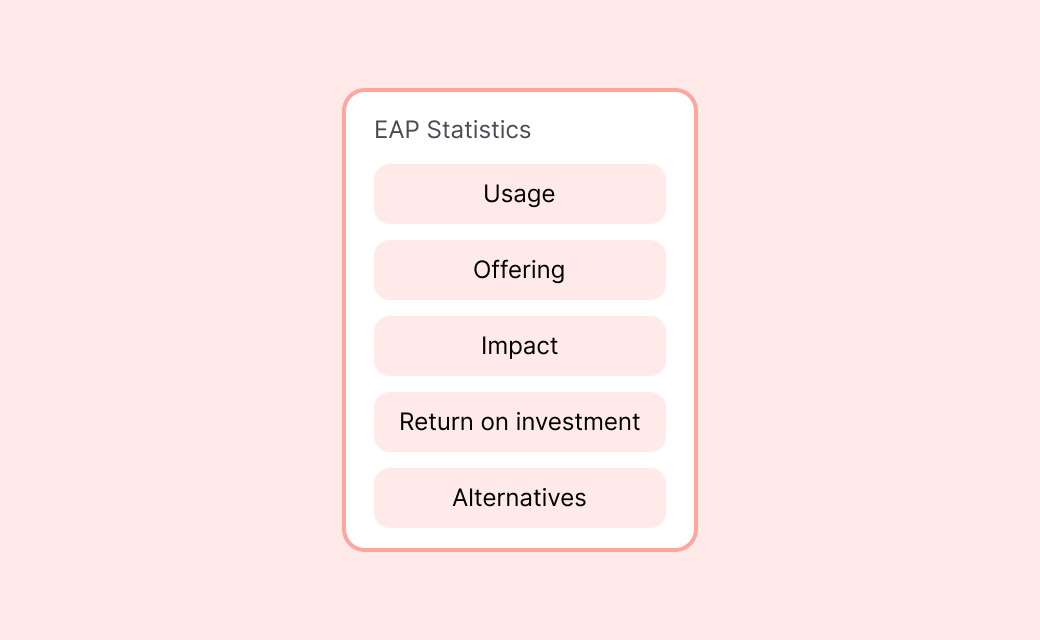
We've put together a comprehensive list of EAP data and statistics covering usage, impact and return on investment to provide all the insight you need to make an informed decision.

Top employee assistance program (EAP) statistics for 2024
- The global Employee Assistance Program market size was valued at around $6.8 billion in 2021, and is expected to reach around $9.4 billion by 2027. [1]
- Only 5% of employees phone their EAP's call center, and 42% of callers who need therapy are rejected. [2]
- There are more than 839 external EAP service providers globally. [3]
- 62% of US civilian workers, around 3 in 5, have access to an EAP through their employer. [4]
- Around 82% of US employers offer an EAP, rising to 98% of midsize and large companies. [5]
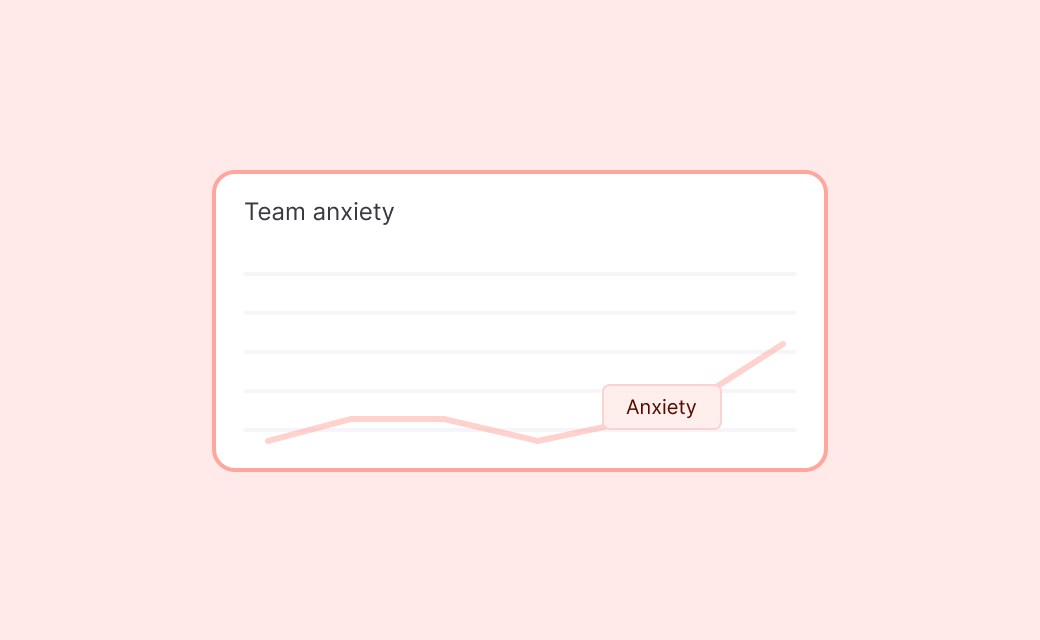
- Anxiety is the number one reason US workers reach out to an EAP, accounting for nearly a quarter (24%) of cases. [6]
- Average EAP usage in the US is below 10%, and typical annual utilization is closer to 3% to 6% of covered employees. This could mean calling the support line or reading self-help resources – not necessarily taking part in counseling sessions. [7,8]
- US employers get back an average ROI of $3 to $10 for every dollar they invest in an EAP due to reduced absenteeism and increased productivity. [7]

US employee assistance program (EAP) statistics
US EAP return on investment (ROI) statistics
- The return on investment for EAPs in the US ranges from $3 to $10 for every $1 invested. [7]
- Workplace Outcome Suite data puts average US EAP ROI at 3:1 for small employers, 5:1 for medium employers and 9:1 for large employers, with savings of $2,000 to $3,500 per counseling case. [9]
US EAP usage statistics
- Demand for workplace mental health support keeps climbing: US mental health related leaves of absence increased 300% between 2017 and 2023. [10]
- The average usage of EAP services by employees in the US is reported as around 3% to 6%. This might mean calling the support line or reading self-help resources – not necessarily receiving any counseling. [7,8]
- An EAP can break even at very low usage: a 1:1 ROI is possible with just one counseling case per every 100 covered employees. [9]
- Most of the financial return from US EAPs comes from reduced presenteeism (87% of total savings) rather than reduced absenteeism (13%). [9]
- Anxiety has overtaken depression as the number one presenting issue among US workers who contact an EAP. [6]
- EAPs are often rolled out to address mental health issues employees face at or outside of work [6]:
- 24% of US workers who reached out for mental health assistance in 2023 did so to get help with anxiety
- Depression and stress are the next most common reasons for contacting an EAP
- Other reasons include partner or relationship issues, family issues, addiction and grief
US EAP usage statistics by identity

- US women with a mental illness are far more likely than men to receive mental health treatment (56.9% vs 41.6%), a gap that carries over into EAP usage. [11]
- Men account for a minority of workplace mental health support cases. They are less likely to reach out for help because of widespread male mental health stigma in the workplace. [10,11]
- 69% of US mental health related leaves of absence in 2023 were taken by women, with millennial women accounting for a third (33%). [10]
- The typical EAP counseling user in the US is around 36 years old. [12]
US EAP access statistics by worker type
According to the US Bureau of Labor Statistics, these are the statistics for EAP access by worker characteristics [4]:
- All civilian workers: 62%
- Full-time workers: 68%
- Part-time workers: 43%
- Union workers: 78%
- Nonunion workers: 60%
- Lowest-paid 25% of workers: 44%
- Second wage quartile: 60%
- Highest-paid 25% of workers: 80%
US EAP usage statistics by company size
- 97% of US companies with more than 5,000 workers use an EAP. [13]
- 80% of US companies with 1,001-5,000 workers use an EAP. [13]
- 75% of US companies with 251-1,000 workers use an EAP. [13]
- EAPs are available to 40% of workers in US establishments with fewer than 100 workers. [14]
How many US companies invest in EAPs:
- 82% of US employers offer an EAP, according to SHRM's 2024 Employee Benefits research. [5]
- 98% of midsize and large US companies have an EAP in place. [5]
- 73% of US employers included an EAP in their mental health offerings in 2022. [15]
- 78% of US union workers have access to an EAP, compared to 60% of their nonunion counterparts. [4]
Why US employees decide not to use their EAP:
- Many US employees simply don't know their company has an EAP: lack of awareness is the biggest barrier to usage. [5]
- Some employees worry their employer will find out they used the EAP, despite confidentiality protections. [5]
- Stigma around mental health stops others from picking up the phone in the first place. [5]
US EAP outcome statistics:
- Among US employees who used EAP counseling, the share at high risk of depression fell from 60% before counseling to 12% afterwards. [16]
- 34% of US EAP users had a work productivity problem before counseling, dropping to 5% after. [16]
- Hours of lost productive time fell from 57.3 to 16.4 hours per month after EAP counseling. [16]
- EAP counseling is typically free at the point of use for employees, and runs separately from a company’s health insurance policy.
- These outcomes come from a peer-reviewed study of 85,432 US EAP cases across 2,679 employers. [16]
Spill gives your team instant access to qualified therapists in just a few clicks.
UK employee assistance program (EAP) statistics
- Outside the US, the UK is one of the world's most developed EAP markets:
- Around 88% of UK employers use an EAP. [17]
- Around 13.8 million employees in the UK are covered by an EAP. [18,17]
- Average UK EAP usage is reported as around 5% of employees, which can mean anything from calling the helpline to reading self-help resources. [19,20]
- UK employers get back an average of £8 for every £1 they invest in an EAP. [21]
- 31% of UK companies have never evaluated the quality or impact of their EAP. [19]
- 44% of UK companies are considering changing their EAP provider and 16% are looking to cancel their EAP service. [19]
- During the pandemic in 2020 and 2021, 347,000 more UK employees turned to support from an EAP compared to previous years. [22]
Spill's take on employee assistance programs
When comparing mental health support systems for your team, remember that EAPs aren’t the only solution out there. It’s important to consider how you’d like your team to interact with the help on offer, the type of support they might need, and how you can measure the impact this service is having on your business.
If you’re looking to provide a more proactive service that spots employees who might be struggling and offers fast and effective support, then you might be in the market for an altogether different kind of care.
Spill’s mental health detection system checks in on your team's mood and mental health every week, and a qualified therapist will reach out automatically to anyone who's feeling low. Typically, Spill will be used by 50% of your team, too – that’s 10 times more employees than an EAP.
EAP guides and resources
For a closer look at the pros and cons of an employee assistance program, check out our EAP resources for employers 👇
- EAPs for start ups and small businesses
- EAP benefits and considerations for employers
- Understanding EAP usage and ROI
- EAP cost per employee
- How to evaluate your EAP
- 7 ways to promote your EAP to employees
- The best UK EAP providers for 2024
- EAP services: what is (and isn’t) included
- How to choose the right EAP
- Are EAPs confidential?
- Is EAP counseling the same as therapy?
- How to build a business case for an EAP
- Types of employee assistance programs (EAPs)
- How to launch your EAP effectively
Get our free EAP evaluation checklist
Make sure you're asking the right questions when buying an EAP (or weighing up the one you already have)
Spill is typically used by 50% of employees in a year. That means up to 10 times as many people get support vs. an EAP.